Investment Objective
To provide long-term capital growth. The fund invests, directly or through investments in securities of other mutual funds, in a portfolio that consists primarily of common shares of Canadian companies selected using a high conviction investment approach. It is expected that investments in foreign securities will not exceed approximately 10 % of the fund's assets.
Fund Details
Investment horizon

Fund volatility

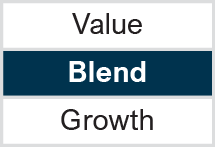
Style
Sector
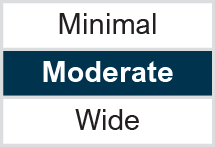
Deviation
Market
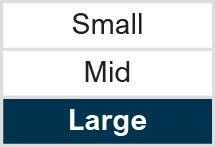
Capitalization


Minimum Initial Investment:
$500
Subsequent Investment:
$50
Systematic Investment:
$25
Distribution Frequency:
Annually
Assets Under Management ($M):
$2,637.5
Price per Unit:
$17.34
Inception Date:
July 14, 2015
Value of $10,000 over 10 years:
$21,734
Benchmark Index:
S&P/TSX Composite
Management Fee:
1.45%
MER:
1.81%
Portfolio Manager:
National Bank Investments Inc.
Sub-Advisor:
Phillips, Hager & North Investment Management
Available Fund Codes:
| Advisor Series | |
|---|---|
| Initial Sales Charge | NBC4243 |
| F Series | NBC4043 |
| F5 Series | NBC4143 |
| T5 Series | |
| Initial Sales Charge | NBC4343 |
Portfolio Asset Mix
(% of Net Assets)
| Canadian Equity | 95.75% |
| Cash and Equivalents | 2.29% |
| Income Trust Units | 1.96% |
| Sector Allocation | % |
|---|---|
| Financial Services | 33.81 |
| Energy | 15.52 |
| Basic Materials | 13.36 |
| Industrial Goods & Services | 9.94 |
| Technology | 9.01 |
| Consumer Goods & Services | 8.21 |
| Real Estate | 4.41 |
| Utilities | 3.59 |
| Telecommunications | 1.79 |
| Healthcare | 0.36 |
| Dividend Yield (Trailing Yield) | 2.42 |
| Top Holdings | % |
|---|---|
| Royal Bank of Canada | 6.65 |
| Shopify Inc Cl | 5.32 |
| Toronto-Dominion Bank | 4.69 |
| Brookfield Corp Cl | 4.36 |
| Enbridge Inc | 3.77 |
| Agnico Eagle Mines Ltd | 3.02 |
| Canadian Imperial Bank of Commerce | 2.68 |
| Canadian Natural Resources Ltd | 2.68 |
| Canadian Pacific Kansas City Ltd | 2.47 |
| Bank of Montreal | 2.45 |
| Total of Top Holdings of the Fund (% of Net Assets): |
38.09 |
| Total Number of Securities Held: | 86 |
Calendar Returns (%)
| YTD | 2024 | 2023 | 2022 | 2021 | 2020 | 2019 |
|---|---|---|---|---|---|---|
| 10.66 | 19.44 | 10.61 | -3.24 | 28.99 | -2.60 | 18.23 |
Annualized Returns (%)
| 1 M | 3 M | 6 M | 1 Y | 3 Y | 5 Y | 10 Y | Incp. |
|---|---|---|---|---|---|---|---|
| 1.46 | 9.61 | 7.50 | 19.21 | 13.28 | 14.97 | 8.07 | 7.82 |
Disclosure
NBI Mutual Funds (the “Funds”) are offered by National Bank Investments Inc. an indirect wholly owned subsidiary of National Bank of Canada and sold by authorized dealers. Commissions, trailing commissions, management fees and expenses all may be associated with investments in the Funds. Please read the prospectus of the Funds before investing. The indicated rates of return are the historical annual compounded total returns which include changes in the value of securities and reinvestment of all distributions and do not take into account sales, redemption, distribution or optional charges or income taxes payable by any unitholder that would have reduced returns. The Funds’ securities are not insured by the Canada Deposit Insurance Corporation or by any other government deposit insurer. For money market funds, there can be no assurances that a fund will be able to maintain its net asset value per security at a constant amount or that the full amount of the investment in a fund will be returned. The Funds are not guaranteed, their values change frequently and past performance may not be repeated.
